
Building a Lambda Architecture GCP Data Pipeline and Dashboard with Vtuber data: My Journey from Idea to Execution
Started with a Simple Idea: What Can I Do with the Vtuber Data? I Created a Comprehensive Lambda Architecture Data Pipeline and an Informative Dashboard.

Hi guys!
I’m Stephen, a data engineer and a data analyst. I'm delighted to welcome you to this article on data analysis. I hope you find it enjoyable and informative!
As a Vtuber lover, I used to spend hours watching live streams daily.
One day, I thought it would be a great idea to compile live stream data into a dashboard. With this idea in mind, I began to take action.
Originally, I used Python for a simple proof of concept (POC), using packages to obtain vtuber’s chat room data and attempting basic analysis.
A year later, in my spare time after work, I migrated this analytical framework to GCP, using tools like Cloud Functions (CFs) and BigQuery (BQ) to reconstruct an end-to-end data pipeline.
While it's not a massive project, it has reached a relatively stable milestone, and I'd like to share it with everyone.
Before we move forward, let’s take a look at the dashboard!

The architecture
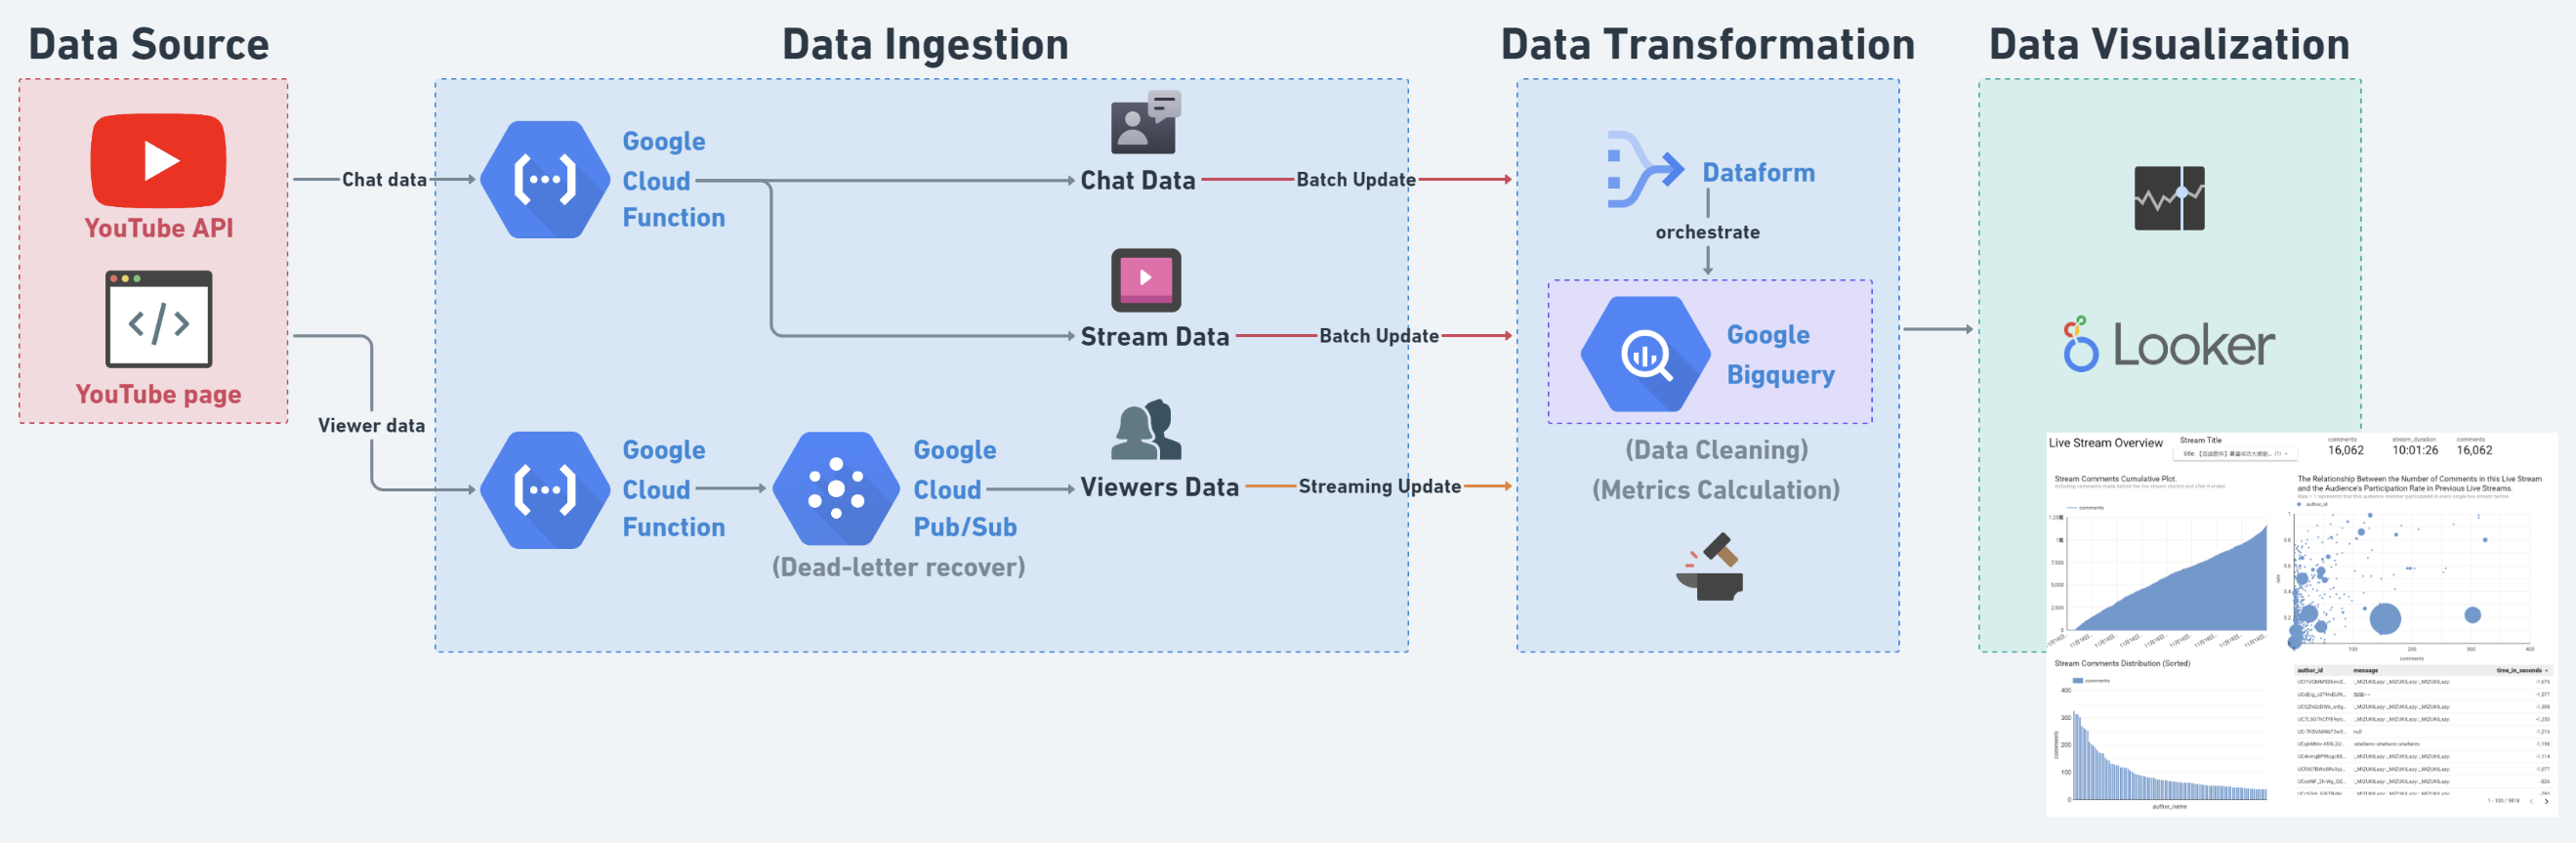
This data pipeline consists of four stages: ELTA (Extract, Load, Transform, Active). I use Cloud Functions and Pub/Sub (Apache Kafka) as tools for the EL stages. For the Transform stage, I use BigQuery as the storage and computation tool, and Dataform (similar to DBT) as the orchestration tool. Finally, I use Looker Studio to visualize the metrics and produce meaningful results.
I will explain the key points of each stage step by step.
Extract Stage and Load Stage
Let’s start with the data sources, I’m using several data sources:
Chat data and donation data.
Live basic information.
Viewers count data.
For the first two, since YouTube stores this data as historical records, I can access them at any time, so I use batch updates.
The last one is more special: it is the real-time viewer count. I aim to capture the viewer count every minute during a live stream. However, YouTube does not store this historical data, meaning I will lose it forever if I don't capture the viewer count during the live stream. The challenge in it is that a live stream can start at any time. I will explain this part in more detail later in the article. :)
Since I need to access the YouTube API, I use three CFs to connect all the data sources. In these CFs, I use Python to fetch the data and perform simple cleaning tasks and finally use the BQ API to create tables or insert data into a table.
In this process, I aimed to decouple the data pipeline as much as possible, so I didn’t assign any complex tasks to these CFs; instead, I left the complex data transformation tasks to BQ.

For the data ingestion part, using CFs to send batch data to BQ is simple. The only thing I need to do is to run it at a fixed time every day to send the latest historical data to BQ.
However, handling streaming data is completely different. As I mentioned, I need to capture the viewer count every minute during a live stream, assuming the stream could start at any time. So I tried two different approaches.
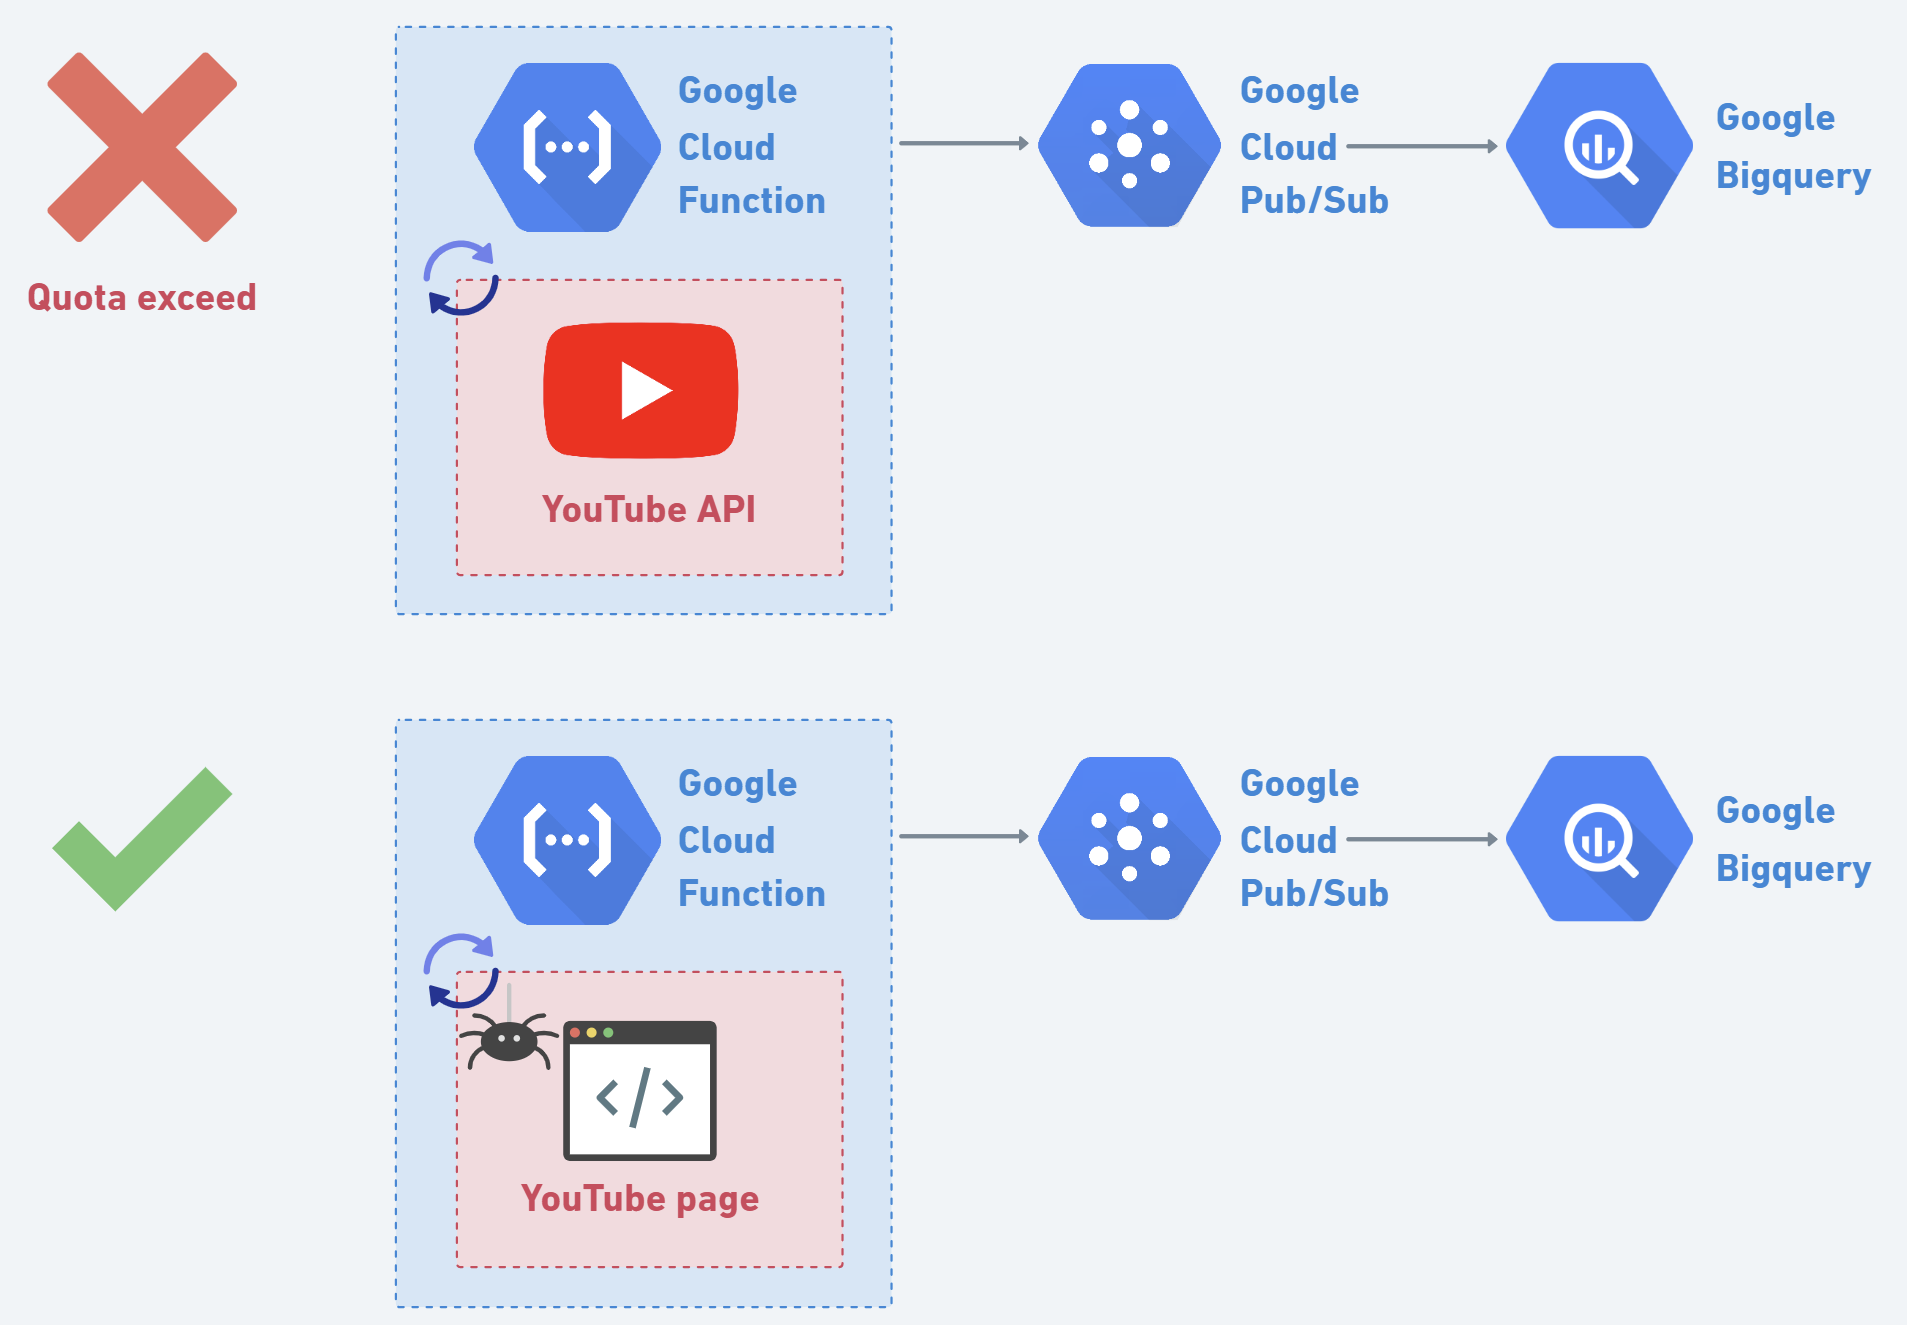
First, I used the YouTube Data API v3, which allows me to fetch information about specific channels. I set up a CF to trigger every minute to check the live status of a specific Vtuber. If there is no live stream at that moment, the function ends, and it will check again the next minute; otherwise, the function returns the current number of viewers. This approach seems great and simple, but it hit the API quota limit in only 45 minutes. If I planned to run a CF 24/7, the required quota would exceed the forecasted limit by more than 20 times.
This led me to abandon the idea of using the official YouTube API. I quickly turned my attention to web scraping. I decided to scrape the live stream information from the channel's homepage. After some effort analyzing the HTML of the YouTube page, I finally found a stable HTML element to scrape. Implementing this solution, I set up a web scraper to fetch the live viewer count every minute.
Next, after obtaining the live stream data, I used Pub/Sub to handle the streaming data and deliver them to the BQ table. I didn’t send it directly from CF to BQ because Pub/Sub provides a dead-letter retry service, which ensures that as much viewer count data as possible is safely delivered to BQ and inserted into the table.
Transform Stage
In the transformation stage, BigQuery is responsible for cleaning the data and joining different tables to calculate key metrics.
Adopting the think-backward approach, I first determined the dashboards I wanted to create to infer the necessary data transformations (this is very important, as thinking about the requirements first and then planning the transformation logic can avoid unnecessary costs):
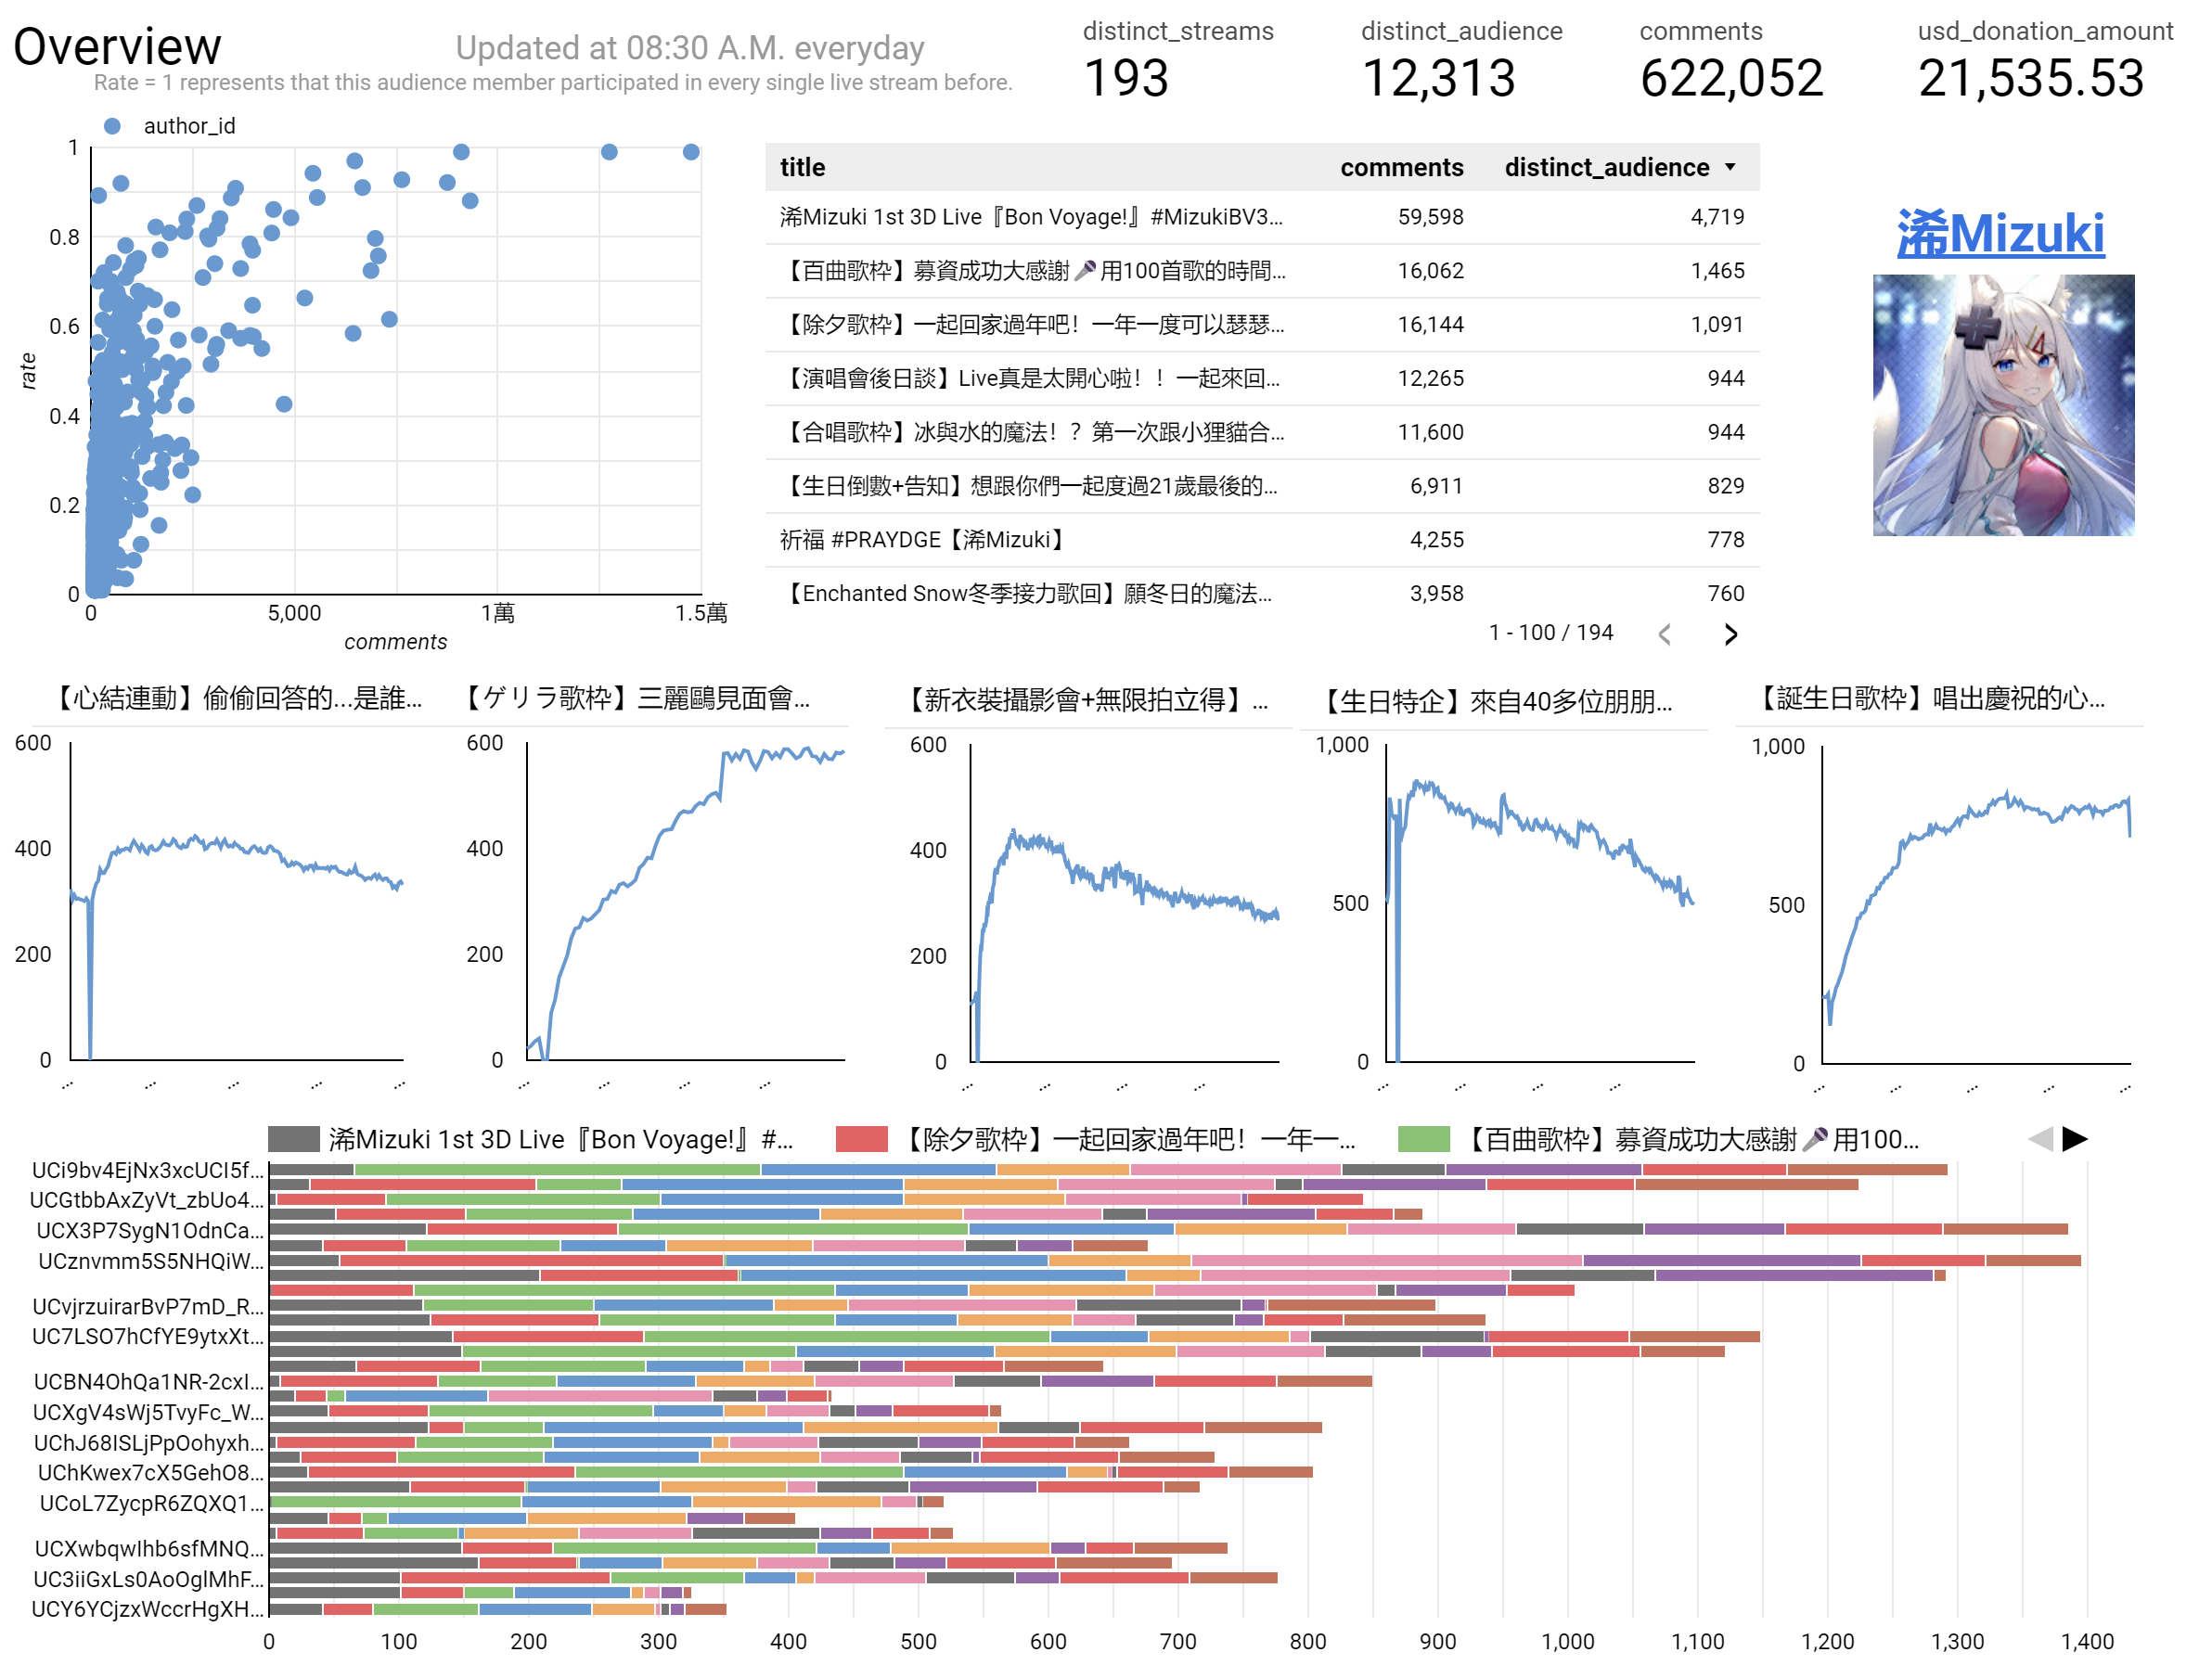
Overview dashboard: Provides basic information about the Vtuber's live streams, including "number of live streams conducted," "total donation amount," "recent live stream viewership," "audience distribution based on engagement," etc.
Live stream dashboard: Provides basic information about the specific live stream, including "number and distribution of comments," "donation amount," "duration of the live stream," "details of comments," etc.
Audience dashboard: Provides basic information about each viewer, including "donation history," "comment activity," "past participation," etc.
After determining the goals, I planned a series of data pipelines to meet the data requirements. I used Dataform as the orchestration tool, constructing a simple dependency tree to schedule BigQuery's computation sequence.

At this stage, I use partitioned tables to ensure that only new data is processed, minimizing query costs as much as possible.
Active Stage
To ensure the dashboard is rich in information yet not cluttered, I divided it into three pages (as previously mentioned):
Overview
On this page, we can get enough information at a glance, including basic details like viewer count of recent streams and audience participation distribution.
Live stream overview
On this page, we can get the basic information of a live stream. The scatter plot on the top right shows the relationship between the audience’s comments, past participation rate, and donation amount (the circle’s size).
It’s interesting to observe that the group donating the most is not the one with the highest engagement.
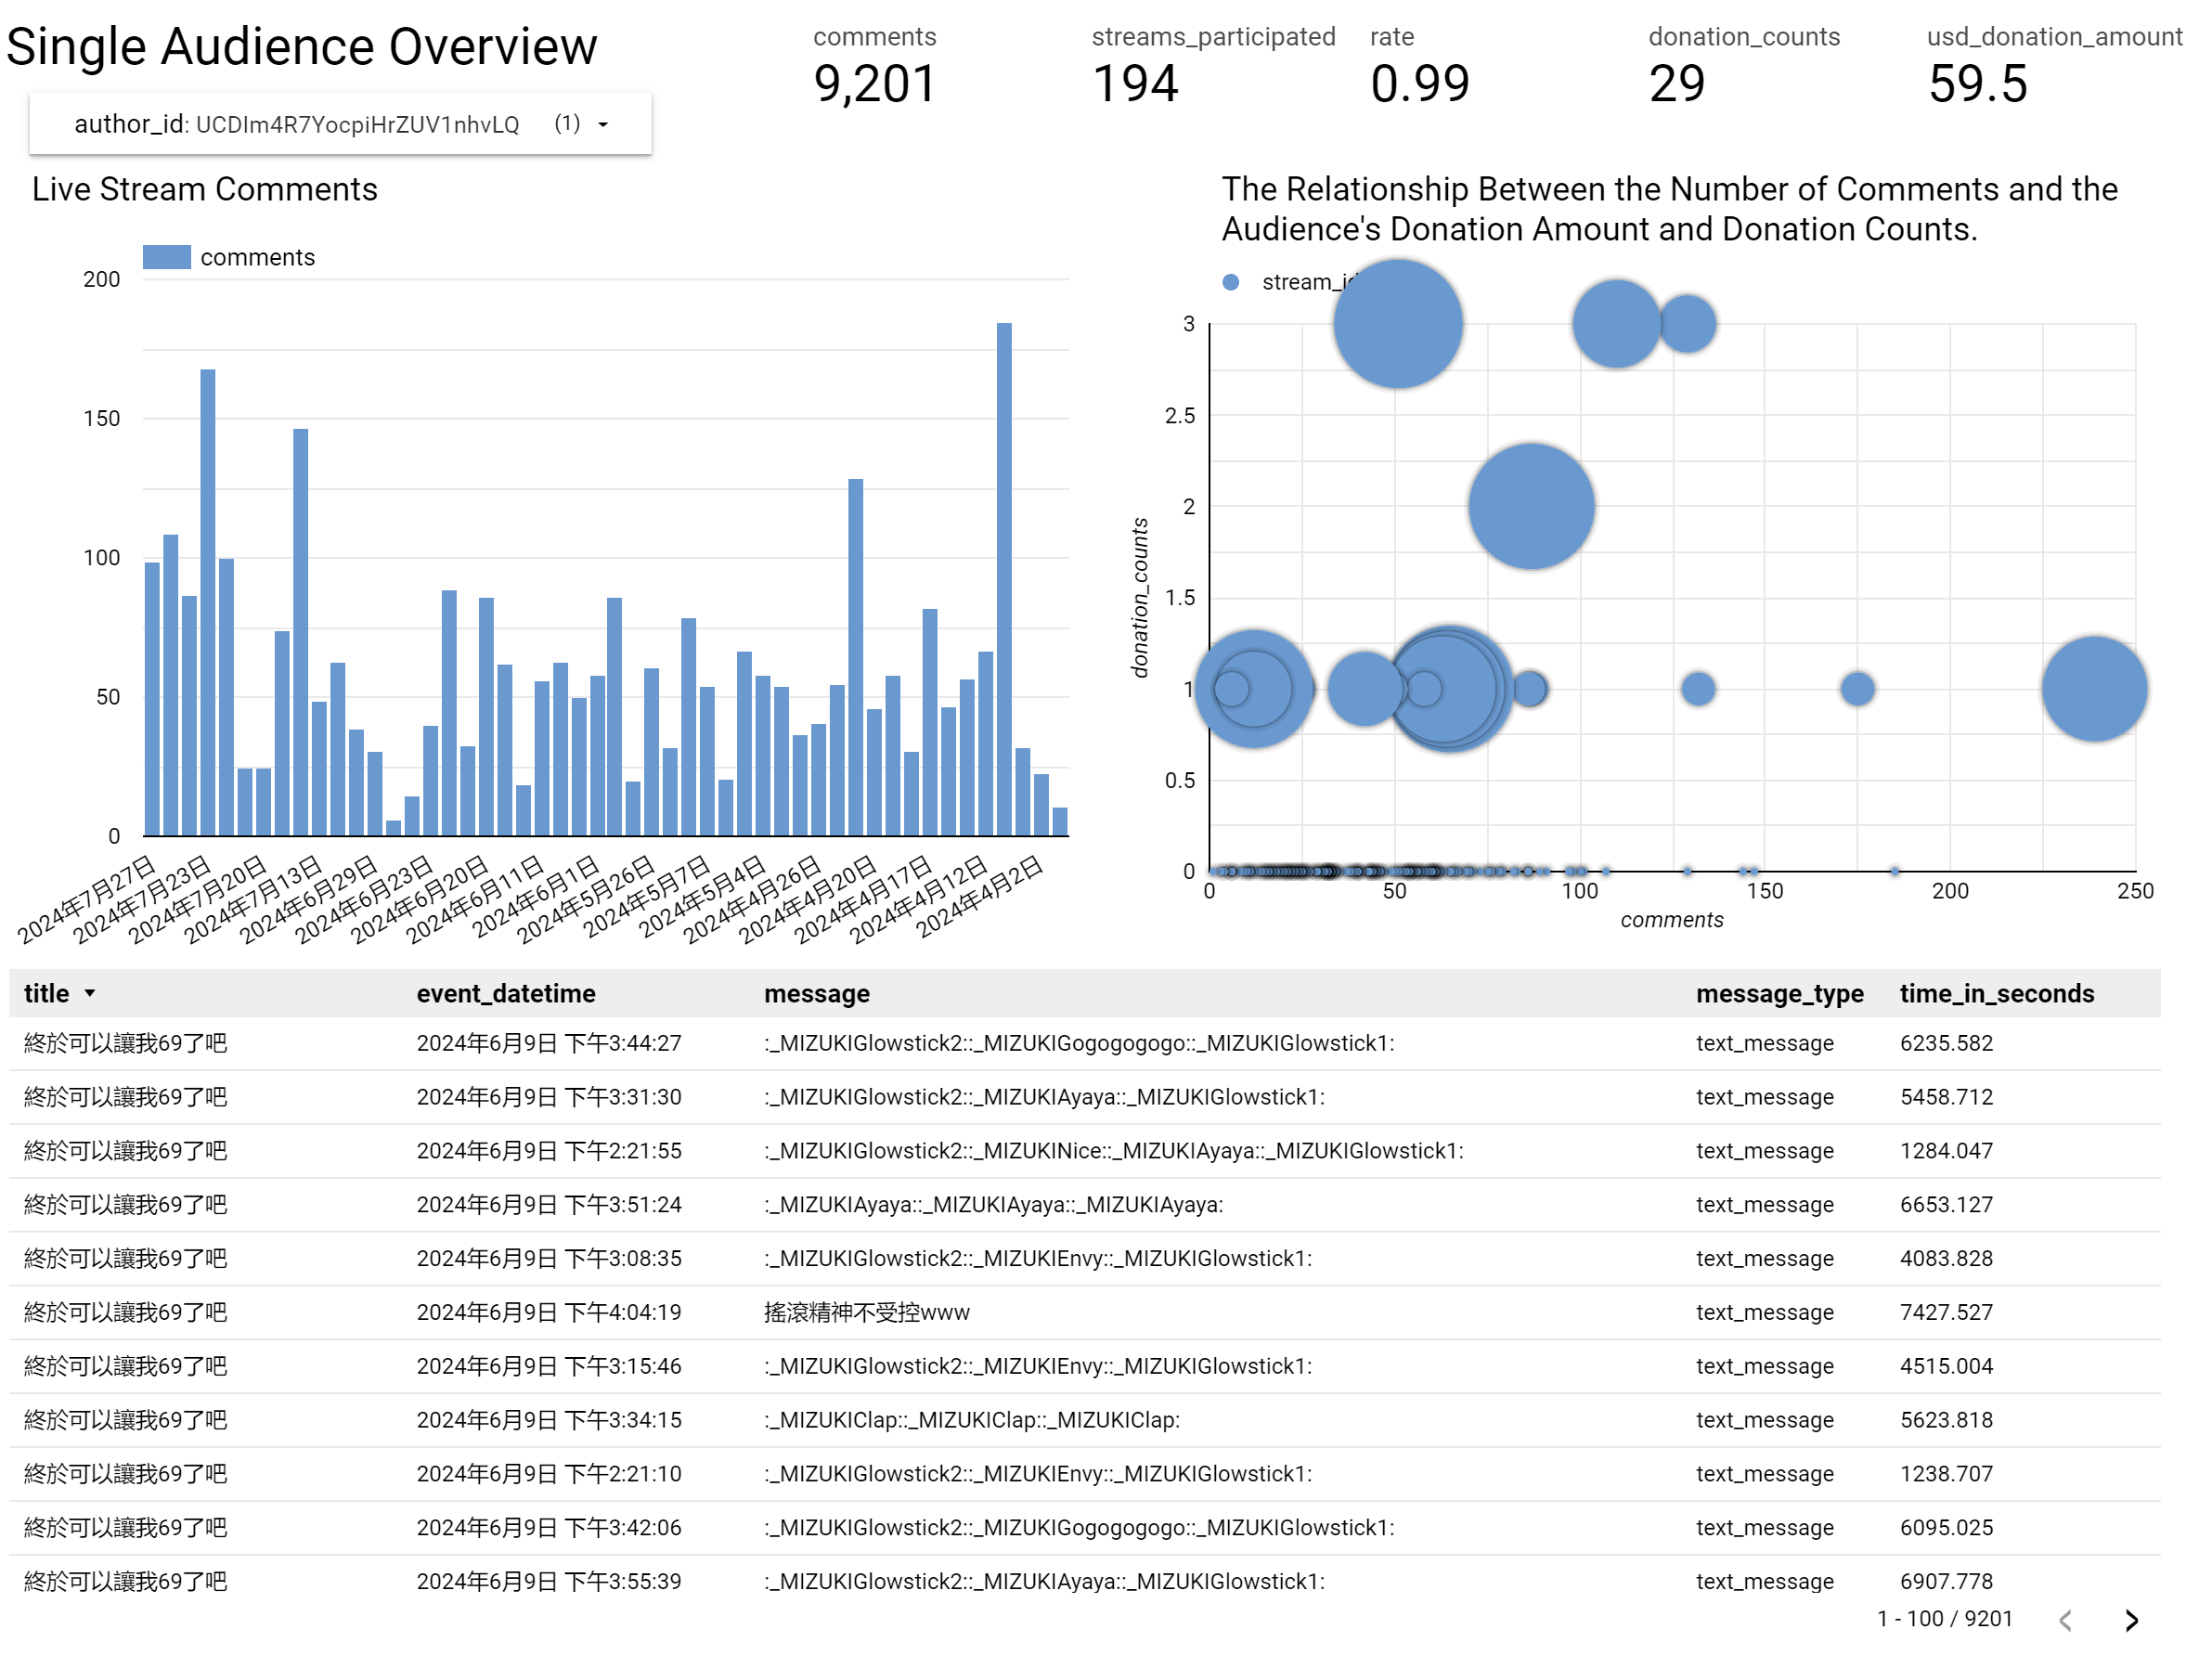
Single audience overview
Finally, we have a page for the single audience, which shows the comments, donations, and participation.
For more details, view the GitHub page by clicking the button below if you want to know more.
Summary
By constructing the lambda architecture data pipeline, I can merge batch-updated comment data with real-time live viewers data. This allowed me to create a dashboard that updates at fixed intervals, consistently presenting information and insights. This has been an interesting side project for me, and in the future, I plan to continue updating this data pipeline and dashboard.
Here are some things I hope to achieve soon:
Integrate large language models (LLMs) for audience sentiment recognition.
Segment audience identities. Since membership subscriptions are a crucial revenue source for Vtubers, this feature can identify whether different live streams can attract viewers to become members (I already have audience membership subscription records).
Continuously improve the data pipeline performance and attempt to scale it (including data from other Vtubers).
Try changing to Kappa architecture (need more research).
If you have any suggestions or comments, or find any mistakes, feel free to leave a message or contact me.
Thanks for reading.
-Stephen Wen

I'd really appreciate your help in enhancing this publication, let me know any feedback through comments, Linkedin, or email.